Canada's House Wealth Gap


Subscribe to receive captivating infographics and data visualizations.
In the ever-evolving landscape of Canadian real estate, the cost of homeownership has increased at a substantial pace. Unfortunately, this surge in market prices has left many aspiring homeowners unable to afford the purchase of a home. For the average Canadian, real estate makes up a significant portion of their net worth – providing them with upward mobility. This adds additional concerns to the immediate housing affordability crisis as being priced out of the housing market could directly impact long-term wealth creation for many Canadians. For a better understanding of the role real estate has on Canadians' financial future – we will break down the net worth of homeowners and renters from the fourth quarter of 2019 to the third quarter of 2023.
Average Net Worth
We’ll begin by exploring the average net worth of Canadians before delving into how real estate influences this financial measure. Net worth represents an individual’s total assets less their total liabilities – both of which will be broken down. To analyze the impact of homeownership on net worth, we’ll examine wealth distribution across five quintiles, consider different age groups, and compare homeowners to renters.
| Characteristic | Q4 2019 | Q3 2023 | Percentage Change |
|---|---|---|---|
| Lowest wealth quintile | -8,637.00 | -885.00 | 89.75% |
| Second wealth quintile | 100,865.00 | 136,362.00 | 35.19% |
| Third wealth quintile | 358,919.00 | 456,244.00 | 27.12% |
| Fourth wealth quintile | 808,937.00 | 993,146.00 | 22.77% |
| Highest wealth quintile | 2,687,328.00 | 3,275,700.00 | 21.89% |
| Less than 35 years | 236,038.00 | 325,446.00 | 37.88% |
| 35 to 44 years | 510,253.00 | 635,555.00 | 24.56% |
| 45 to 54 years | 1,041,540.00 | 1,288,409.00 | 23.70% |
| 55 to 64 years | 1,215,085.00 | 1,511,862.00 | 24.42% |
| 65 years and over | 903,742.00 | 1,087,484.00 | 20.33% |
| Owner | 1,070,444.00 | 1,326,051.00 | 23.88% |
| Renter | 218,130.00 | 259,369.00 | 18.91% |
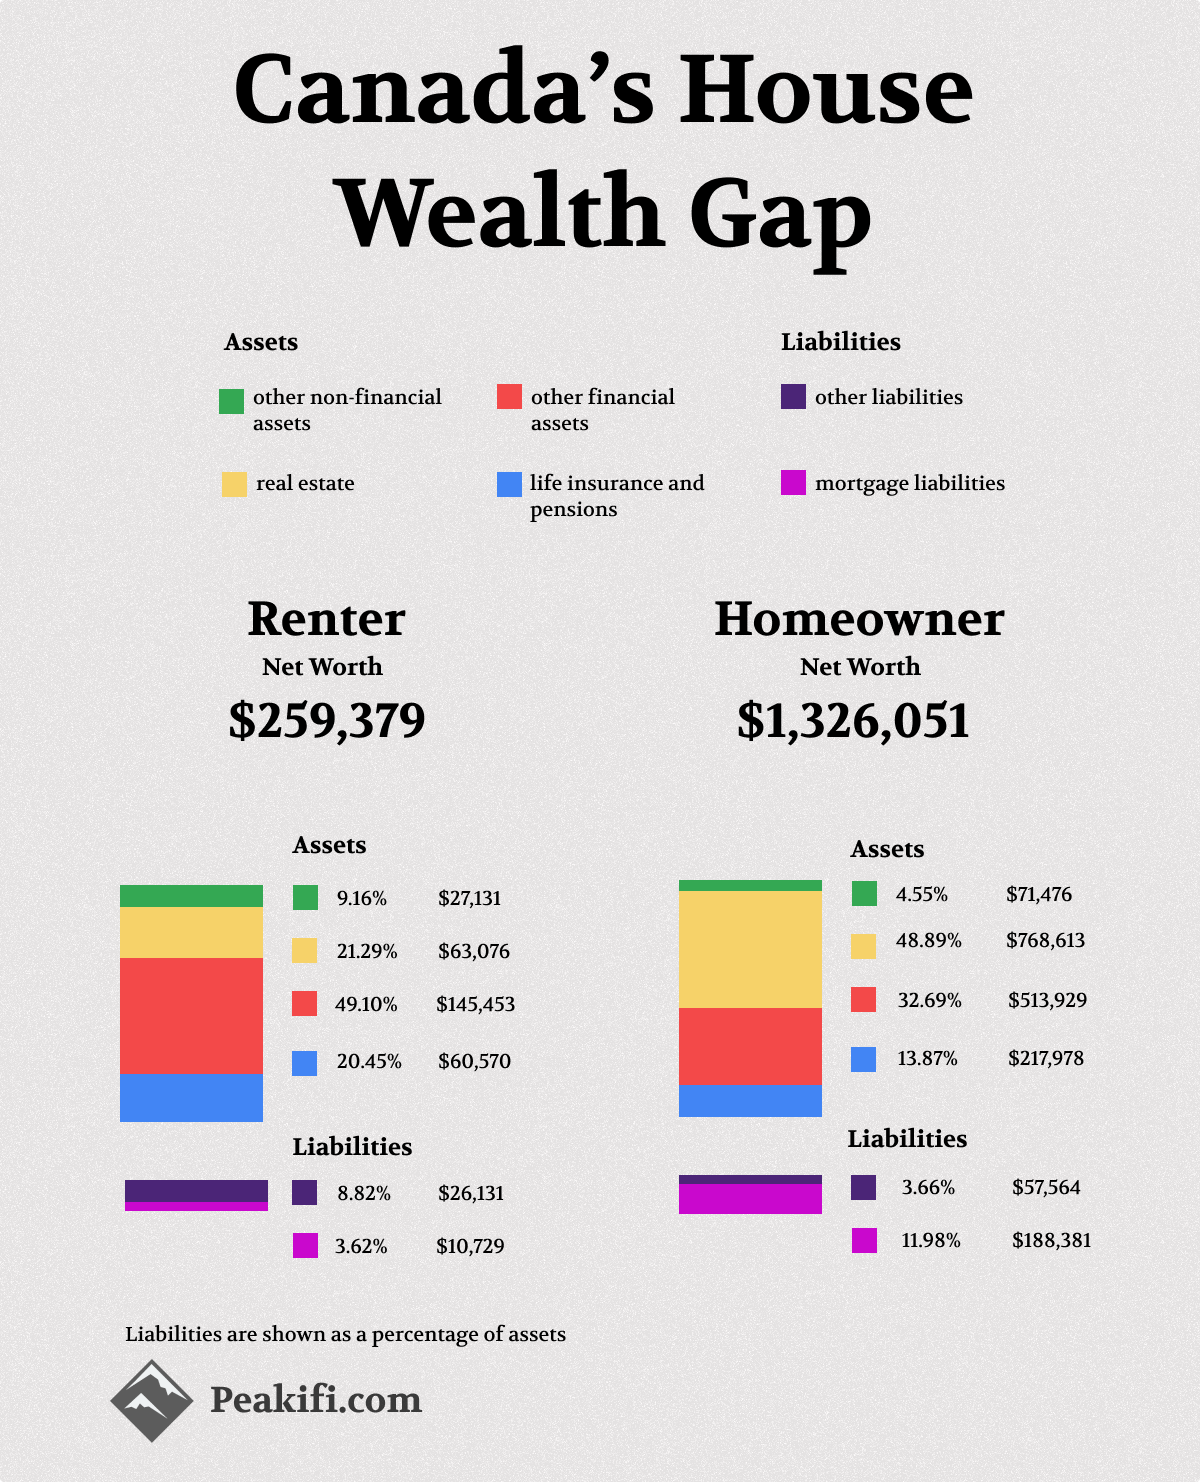
From the provided table, a clear disparity emerges between homeowners and renters in terms of net worth. Homeowners boast a substantial net worth of $1,326,051, while renters lag with a net worth of $259,369. This staggering difference of $1,066,682 underscores the significant wealth gap between the two groups. The wealth quintiles show the lowest wealth quintile (representing the lowest 20%), individuals exhibit a negative net worth of $885, indicating that their liabilities outweigh their assets. The highest wealth quintile enjoys a robust net worth of $3,275,700. Age also plays a pivotal role in net worth. Those under 35 years old have a modest net worth of $236,038. Meanwhile, individuals aged 55 to 64 hold the highest net worth within the group, amounting to $1,215,085.
Assets across Canadian groups
The assets that Canadians own are categorized into two categories which are financial assets and non-financial assets. Real estate is considered a non-financial asset that has been separated to determine its impact on net worth. The largest disparity between real estate as a percentage of assets is the difference between owners and renters. Real estate makes up 48.89% of assets for owners whereas renters only have 21.29% total assets in real estate. Looking across all five wealth quintiles we can see that real estate makes up a substantial portion of total assets – the first four quintiles have a majority of real estate, with the last quintile showing increased financial assets. We can also see that real estate has a great impact on wealth across the five age categories with those 44 years and younger having the majority of their wealth in real estate. We can see that those 45 and older have the majority of this wealth in financial assets.
| Characteristic | Total Assets | Real estate | Financial assets | Other Non-financial assets |
|---|---|---|---|---|
| Lowest wealth quintile | 57,630.00 | 52.31% | 20.03% | 27.66% |
| Second wealth quintile | 272,670.00 | 56.86% | 29.87% | 13.27% |
| Third wealth quintile | 664,434.00 | 58.79% | 33.41% | 7.80% |
| Fourth wealth quintile | 1,218,802.00 | 54.57% | 39.88% | 5.55% |
| Highest wealth quintile | 3,529,872.00 | 40.56% | 56.26% | 3.18% |
| Less than 35 years | 498,015.00 | 58.31% | 33.67% | 8.01% |
| 35 to 44 years | 925,897.00 | 56.08% | 37.26% | 6.66% |
| 45 to 54 years | 1,598,078.00 | 49.16% | 46.07% | 4.77% |
| 55 to 64 years | 1,681,292.00 | 41.91% | 53.82% | 4.27% |
| 65 years and over | 1,134,580.00 | 40.83% | 55.18% | 4.00% |
| Owner | 1,571,996.00 | 48.89% | 46.56% | 4.55% |
| Renter | 296,229.00 | 21.29% | 69.55% | 9.16% |
Liabilities across Canadian Groups
Liabilities are categorized into two primary groups including mortgage liabilities and other liabilities – this shows that while real estate represents a large portion of Canadian assets, it also represents the majority of liabilities Canadians carry. For the average owner, liabilities of $245,945 outweigh the total liabilities of the renter at $36,860. Of these $245,945 worth of liabilities, 76.59% represents mortgage liabilities, compared to mortgage liabilities of $10,729 or 29.11% that the renter holds. We can see that the lowest wealth quintile is the only one that does not have the majority of liabilities as mortgage liabilities. However, this quintile still relies on real estate to make up the majority of their assets. We can also see that mortgage liabilities make up the majority of liabilities for all age groups with those 35 to 44 years old having 80.26% of their total liabilities as mortgage liabilities.
| Characteristic | Total Liabilities | Mortgage liabilities | Other liabilities |
|---|---|---|---|
| Lowest wealth quintile | 58,515.00 | 43.28% | 56.72% |
| Second wealth quintile | 136,308.00 | 73.60% | 26.40% |
| Third wealth quintile | 208,190.00 | 78.03% | 21.97% |
| Fourth wealth quintile | 225,656.00 | 75.84% | 24.16% |
| Highest wealth quintile | 254,173.00 | 73.93% | 26.07% |
| Less than 35 years | 172,568.00 | 75.14% | 24.86% |
| 35 to 44 years | 290,343.00 | 80.26% | 19.74% |
| 45 to 54 years | 309,669.00 | 75.96% | 24.04% |
| 55 to 64 years | 169,429.00 | 62.92% | 37.08% |
| 65 years and over | 47,096.00 | 56.31% | 43.69% |
| Owner | 245,945.00 | 76.59% | 23.41% |
| Renter | 36,860.00 | 29.11% | 70.89% |
Real Estate as a Percentage of Wealth
We will now look at the net worth across the groups as of Q3 2023 to see what total percentage of their wealth can be attributed to real estate. The total net impact real estate has on wealth is determined by taking the value of the real estate and subtracting the mortgage liability that is still outstanding. Once we do this, we will see that real estate contributes positively across all groups – this even includes the lowest wealth quantile which has a negative overall net worth. Looking at the owner, we can see that real estate makes up 43.76% or $580,232 of total net worth. This makes sense as while real estate was the largest asset for the owner at $768,613 including the mortgage liabilities of $188,381 overall decreases the positive impact real estate has on net worth to $580,232. Looking at the renter, we can see that real estate contributes 20.18% or $52,347 of the overall wealth in Q3 2023.
It is also important to consider that while we saw an increase in real estate as an asset, we also saw an increase in the mortgage liabilities which lowered the overall impact real estate has on net worth. With rising real estate prices come increased mortgages to afford those prices. We can also see an interesting relationship between real estate prices and mortgage liabilities among the different age groups. For those in the 55 to 65-year-old category, their real estate assets remain high while their mortgage liabilities are low – possibly indicating their mortgage being paid off. We can see that across the age groups, the positive impact real estate has on total net worth as a dollar value increases as individuals increase in age up until they are between 55 to 64 years old. Furthermore, looking at the five wealth quintiles we can see that real estate makes up a large percentage of overall wealth.
| Characteristic | Q3 2023 Net Worth | Real Estate Net Mortgage Liabilities | Percentage of Wealth |
|---|---|---|---|
| Lowest wealth quintile | -885.00 | 4,821.00 | N/A |
| Second wealth quintile | 136,362.00 | 54,723.00 | 40.13% |
| Third wealth quintile | 456,244.00 | 228,141.00 | 50.00% |
| Fourth wealth quintile | 993,146.00 | 493,919.00 | 49.73% |
| Highest wealth quintile | 3,275,700.00 | 1,243,762.00 | 37.97% |
| Less than 35 years | 325,446.00 | 160,746.00 | 49.39% |
| 35 to 44 years | 635,555.00 | 286,234.00 | 45.04% |
| 45 to 54 years | 1,288,409.00 | 550,401.00 | 42.72% |
| 55 to 64 years | 1,511,862.00 | 598,003.00 | 39.55% |
| 65 years and over | 1,087,484.00 | 436,689.00 | 40.16% |
| Owner | 1,326,051.00 | 580,232.00 | 43.76% |
| Renter | 259,369.00 | 52,347.00 | 20.18% |
Real Estate as a Percentage of Wealth Change
We have now established that real estate makes up the majority of assets held by Canadians – but still, how does this real estate impact their wealth?
| Characteristic | Q4 2019 Net Worth | Q3 2023 Net Worth | Increase in Net worth | Increase from Real Estate |
|---|---|---|---|---|
| Lowest wealth quintile | -8,637.00 | -885.00 | 89.75% | -2.72% |
| Second wealth quintile | 100,865.00 | 136,362.00 | 35.19% | 41.41% |
| Third wealth quintile | 358,919.00 | 456,244.00 | 27.12% | 71.36% |
| Fourth wealth quintile | 808,937.00 | 993,146.00 | 22.77% | 82.66% |
| Highest wealth quintile | 2,687,328.00 | 3,275,700.00 | 21.89% | 67.31% |
| Less than 35 years | 236,038.00 | 325,446.00 | 37.88% | 67.01% |
| 35 to 44 years | 510,253.00 | 635,555.00 | 24.56% | 75.36% |
| 45 to 54 years | 1,041,540.00 | 1,288,409.00 | 23.70% | 70.66% |
| 55 to 64 years | 1,215,085.00 | 1,511,862.00 | 24.42% | 66.37% |
| 65 years and over | 903,742.00 | 1,087,484.00 | 20.33% | 67.16% |
| Owner | 1,070,444.00 | 1,326,051.00 | 23.88% | 71.09% |
| Renter | 218,130.00 | 259,369.00 | 18.91% | 42.56% |
source: STATSCAN