Historical Fixed Mortgage Rates in Canada (1980 to 2024)


Learning about the history of mortgage rates in Canada will help you understand how mortgage rates have changed over the decades – and further understand what factors resulted in the mortgage rates responding the way they did. Knowing this mortgage rate history will help you make more informed financial decisions. This includes if you are a first-time homebuyer looking to purchase a home or if you are an existing homeowner who holds a mortgage up for renewal. These historical rates can help you answer some important mortgage questions such as what length of mortgage term you should pick up as well as if you will get a fixed or variable rate mortgage.
What is a posted mortgage rate?
All of the rates listed in this article are based on the posted mortgage rates since historical data has been collected on the posted mortgage rates by the Bank of Canada. Posted mortgage rates are the rates that banks advertise to their customers and use as benchmarks for their mortgage products. This allows banks to discount the posted rate to provide you with a rate that will be used in the calculation of mortgage payments. A bank's ability to discount the posted mortgage rate will depend on factors such as the length of the mortgage term, market conditions, and your relationship with the bank.
What is the highest mortgage rate in Canadian history?
The highest posted mortgage rate in Canada happened in 1981 for the 5-year, 3-year, and 1-year fixed mortgage rates. The highest 5-year fixed mortgage rate was 21.75%, followed by the 3-year fixed mortgage at 21.50% all-time high, and the 1-year fixed mortgage rate high of 21.25%.
What is the lowest mortgage rate in Canadian history?
The lowest posted mortgage rate in Canada for the 5-year fixed mortgage rate occurred throughout 2016-2017 at a rate of 4.64%. The lowest 3-year fixed mortgage rate was from the period of 2015-2017 at 3.39%. Lastly, the lowest 1-year fixed mortgage rate, which is the lowest posted mortgage rate happened throughout 2021-2022 at a rate of 2.79%.
If you want to see if the mortgage rate is viable for you. Use a mortgage affordability calculator to see how much house you can afford.
Average Fixed Mortgage Rates
| Decade | 5-Year | 3-Year | 1-Year |
|---|---|---|---|
| 1980's | 13.60% | 13.30% | 12.61% |
| 1990's | 9.09% | 8.72% | 7.97% |
| 2000's | 6.79% | 6.34% | 5.76% |
| 2010's | 5.10% | 3.86% | 3.28% |
| 2020's | 5.56% | 4.76% | 4.50% |
When looking at the average mortgage rates across the decades the difference between the average 5-year, 3-year, and 1-year fixed mortgage rates are relatively similar with only 1% - 2% differences within each decade. Looking across each decade we can also see that the posted average 5-year fixed mortgage rate is the highest of the three mortgage terms with the 1-year mortgage rate having the lowest posted rate in each decade. We can also see that the average mortgage rates historically for Canada saw a peak in the 1980s with an average 5-year fixed rate of 13.60% which later decreased to a low of 5.10% in 2010.
How are fixed mortgage rates determined?
Fixed mortgage rates are influenced in Canada by the 5-year bond yield set out by the Government of Canada. Since bonds issued by the Government of Canada are considered to be very safe investments, the yield that they pay out acts as a benchmark for 5-year mortgage rates issued by banks. Since mortgages are considered riskier than bonds, the banks add a risk premium onto the mortgage rates they charge.
A breakdown of mortgage rates within the decades
When we look at the maximum and minimum fixed mortgage rates for the 5-year, 3-year, and 1-year mortgage terms, we can see that the range between the highest and lowest mortgage rates posted varies widely depending on the decade. We now know that the fixed mortgage rates are closely tied to the 5-year bond yield issued by the Government of Canada. Since the yield on these bonds is directly impacted by the benchmark overnight rate set by the Bank of Canada, we can look at significant events that would cause the Bank of Canada to change the benchmark overnight rate to explain these interest rates throughout the decades.
High Fixed Mortgage Rates
| Decade | 5-Year | 3-Year | 1-Year |
|---|---|---|---|
| 1980's | 21.75% | 21.50% | 21.25% |
| 1990's | 14.25% | 14.25% | 14.25% |
| 2000's | 8.75% | 8.55% | 8.30% |
| 2010's | 6.25% | 4.75% | 3.80% |
| 2020's | 7.04% | 7.24% | 8.09% |
Low Fixed Mortgage Rates
| Decade | 5-Year | 3-Year | 1-Year |
|---|---|---|---|
| 1980's | 10.00% | 9.75% | 9.00% |
| 1990's | 6.60% | 6.20% | 5.05% |
| 2000's | 5.25% | 4.15% | 3.60% |
| 2010's | 4.64% | 3.39% | 2.89% |
| 2020's | 4.79% | 3.45% | 2.79% |
The 1980's
In 1981 the benchmark overnight lending rate was raised by the Bank of Canada to 21%. This directly impacted the price of the 5-year bonds issued by the Government of Canada which further impacted mortgage rates issued by the banks. This rise in the overnight rate was an attempt to slow down the high inflation that was being experienced by the economy.
- Average 5-year fixed mortgage rate: 13.60%
- 5-Year fixed rate range: 10.00% - 21.75%
The 1990's
Since the economy was experiencing reduced inflation, the Bank of Canada was able to lower its overnight rate (policy interest rate) in an attempt to stimulate the economy. This decrease in the policy interest rate directly impacts the 5-year bond rate which flows to the 5-year fixed mortgage rate.
- Average 5-year fixed mortgage rate: 9.09%
- 5-Year fixed rate range: 6.60% - 14.25%
The 2000's
Mortgage rates continued to decrease in the 2000s as Canada tried to stimulate the economy by lowering the overnight rate charged by the Bank of Canada. Canada was experiencing a global recession which was a result of the housing market crash in the United States. This decrease in the overnight rate provided banks with cheap capital to borrow in which they were able to offer better mortgage rates to their customers.
- Average 5-year fixed mortgage rate: 6.79%
- 5-Year fixed rate range: 5.25% - 8.75%
The 2010's
As the Canadian economy recovered from the housing crash in the previous decade, the Bank of Canada increased the overnight rate from 0.75% at the start of the decade in 2010 to 1.75% nearing the end of the decade. This increase in the overnight rate caused the fixed mortgage rate charged by banks to increase over the decade from 4.64% to 6.25% for an average 5-year fixed mortgage rate of 5.10%.
- Average 5-year fixed mortgage rate: 5.10%
- 5-Year fixed rate range: 4.64% - 6.25%
The 2020's
The average 5-year fixed mortgage rate as well as the range are based on data from 2020 - 2024 since we are still adding data to this decade. So far Canada started off the decade experiencing rate cuts which helped to stimulate the economy – in doing so the Bank of Canada reached a record low benchmark rate of 0.25%. Canada has since been battling increasing inflation with interest rate increases pushed by the Bank of Canada.
- Average 5-year fixed mortgage rate: 5.56%
- 5-Year fixed rate range: 4.79% - 7.04%
Mortgage Payments over the Decades
| Year | Price | Average Rate | Mortgage Payment | 2023 inf adj. |
|---|---|---|---|---|
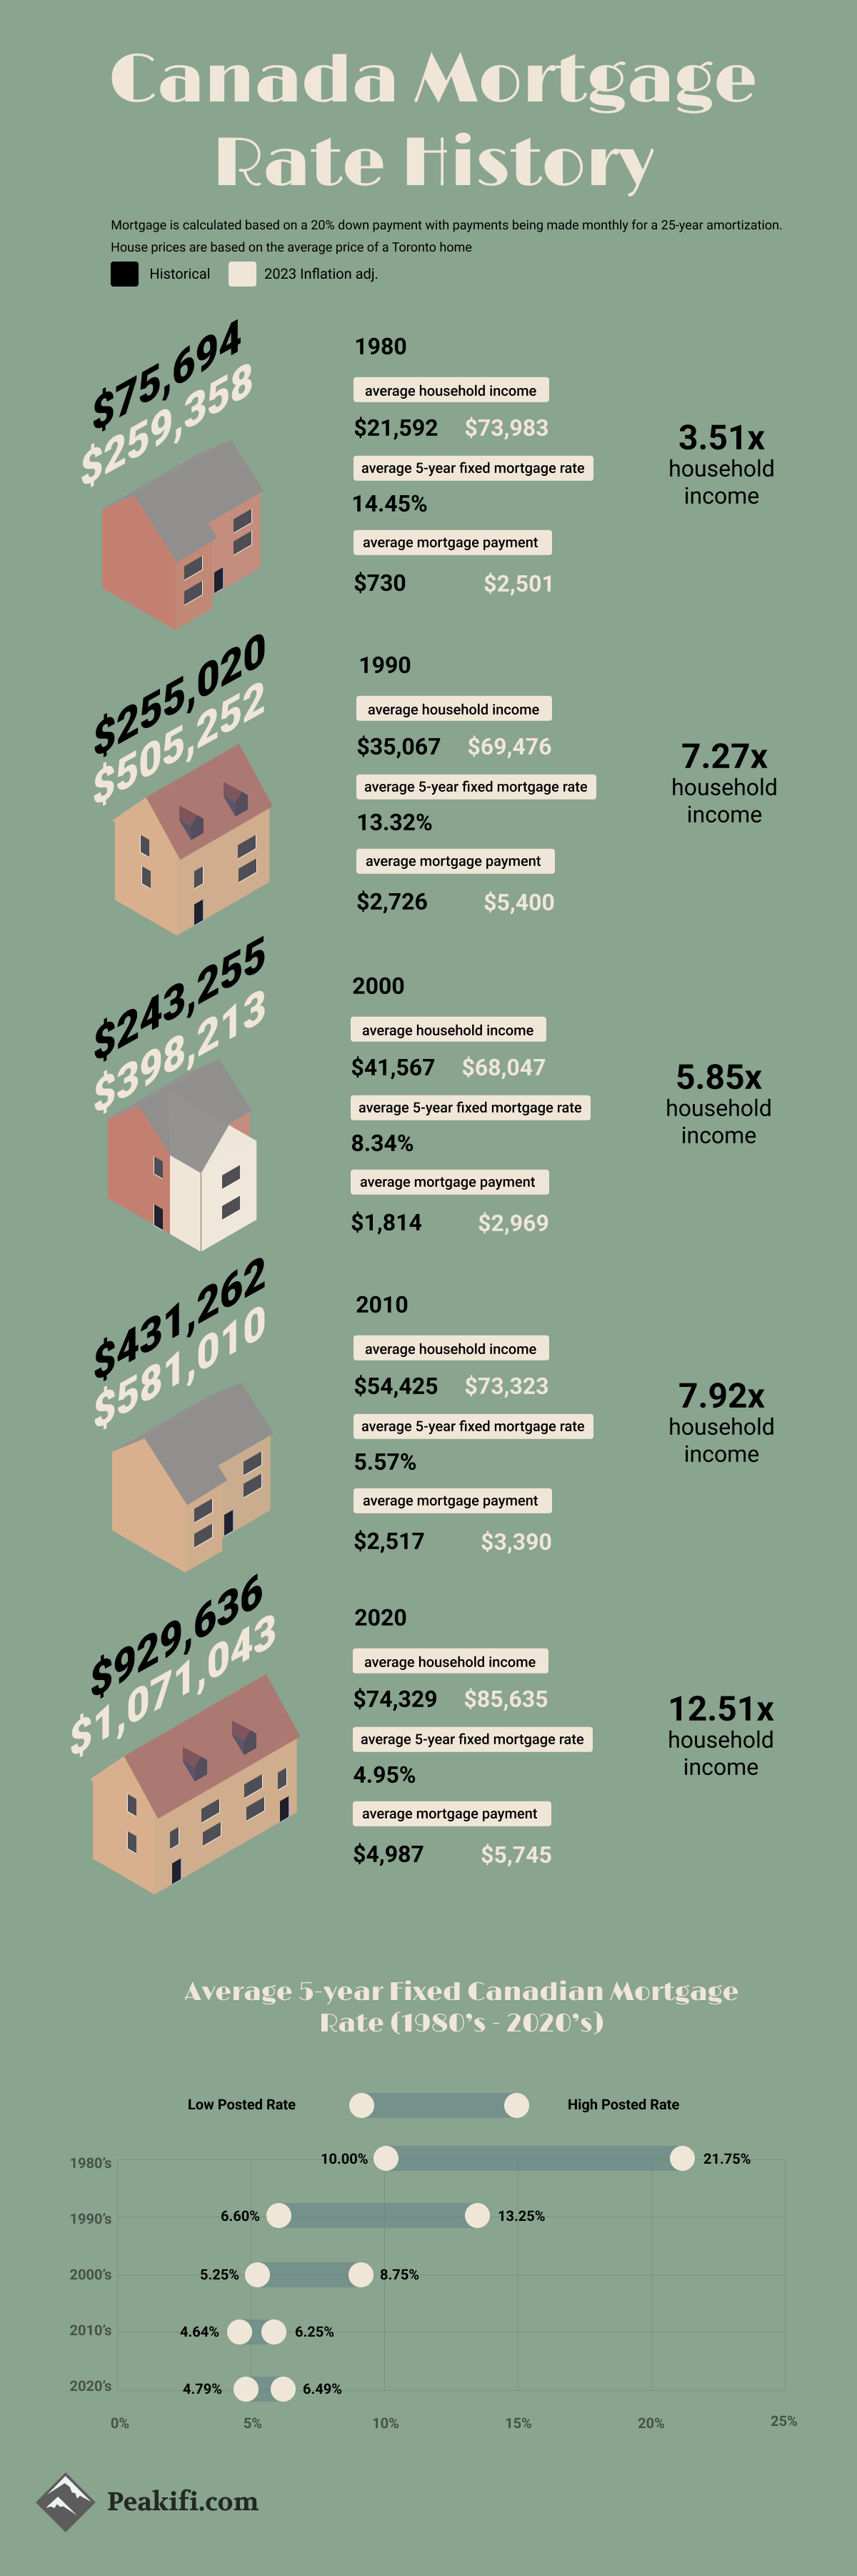
| 1980 | $75,694 | 14.45% | $730 | $2,501 |
| 1990 | $255,020 | 13.32% | $2,726 | $5,400 |
| 2000 | $243,255 | 8.34% | $1,814 | $2,969 |
| 2010 | $431,262 | 5.57% | $2,517 | $3,390 |
| 2020 | $929,630 | 4.95% | $4,987 | $5,745 |
To better understand the full impact these historical mortgage rates have had throughout Canadian history, we wanted to find the average price of a Toronto house and adjust for inflation, what the monthly mortgage payment would be with these historical rates. This mortgage calculation uses the average historical price of a house in Toronto in the year listed and calculates the mortgage payment with the historical rate assuming a 20% down payment. This mortgage payment is then adjusted for inflation to see how it compares to current-day mortgage payments.
From performing this calculation we can see that the highest inflation-adjusted mortgage payment is $5,745 which is based on the average price of a Toronto home in 2020, using the historical average 5-year fixed mortgage rate of 4.95% in the year 2020. This current mortgage payment is a substantial increase over the inflation-adjusted mortgage payments of the past couple of decades. Despite the lowest average rate presented in the above table throughout the decades, the sharp increase in the average price of a Toronto house makes the inflation-adjusted mortgage payment the highest throughout the decades.
Household Income to House Price
| Year | Price | Household Income | Ratio |
|---|---|---|---|
| 1980 | $75,694 | $21,592 | 3.51x |
| 1990 | $255,020 | $35,067 | 7.27x |
| 2000 | $243,255 | $41,567 | 5.85x |
| 2010 | $431,262 | $54,425 | 7.92x |
| 2020 | $929,636 | $74,329 | 12.51x |
We can look at the historical price of a house compared to the historical median household income to find out how many times income the average house purchase would make up. Since household income is a good indicator of the size of a mortgage that you can afford, looking at the relationship between the two can show us how affordable Canadian houses were historically. We can see that although 1980 had very high historical mortgage rates, houses were still quite affordable as the average household income was only 3.51x the average price of a house in Toronto. Alternatively, as the mortgage rates decreased over the decades, the average price of a house increased faster than income which resulted in a 12.51x the average household income to make up the cost of the average home price.
sources:
- https://trreb.ca/files/market-stats/market-watch/historic.pdf
- https://www.bankofcanada.ca/rates/banking-and-financial-statistics/posted-interest-rates-offered-by-chartered-banks/
- https://www150.statcan.gc.ca/t1/tbl1/en/tv.action?pid=1110019001&pickMembers%5B0%5D=1.1&cubeTimeFrame.startYear=1980&cubeTimeFrame.endYear=2021&referencePeriods=19800101%2C20210101