XEQT Breakdown - The All Equity Portfolio ETF


XEQT has been designed to provide investors with long-term capital growth – a worthy investment objective that many strive for. This all-equity exchange-traded fund (ETF) offers a simple solution that provides investors with broad market exposure to developed and emerging markets. With extensive diversification to help maximize returns while mitigating risk, a low-cost structure, and automatic rebalancing XEQT has become a popular choice among investors. This article will look into the composition, performance, and other important factors to help you fully understand XEQT.
Underlying ETF's
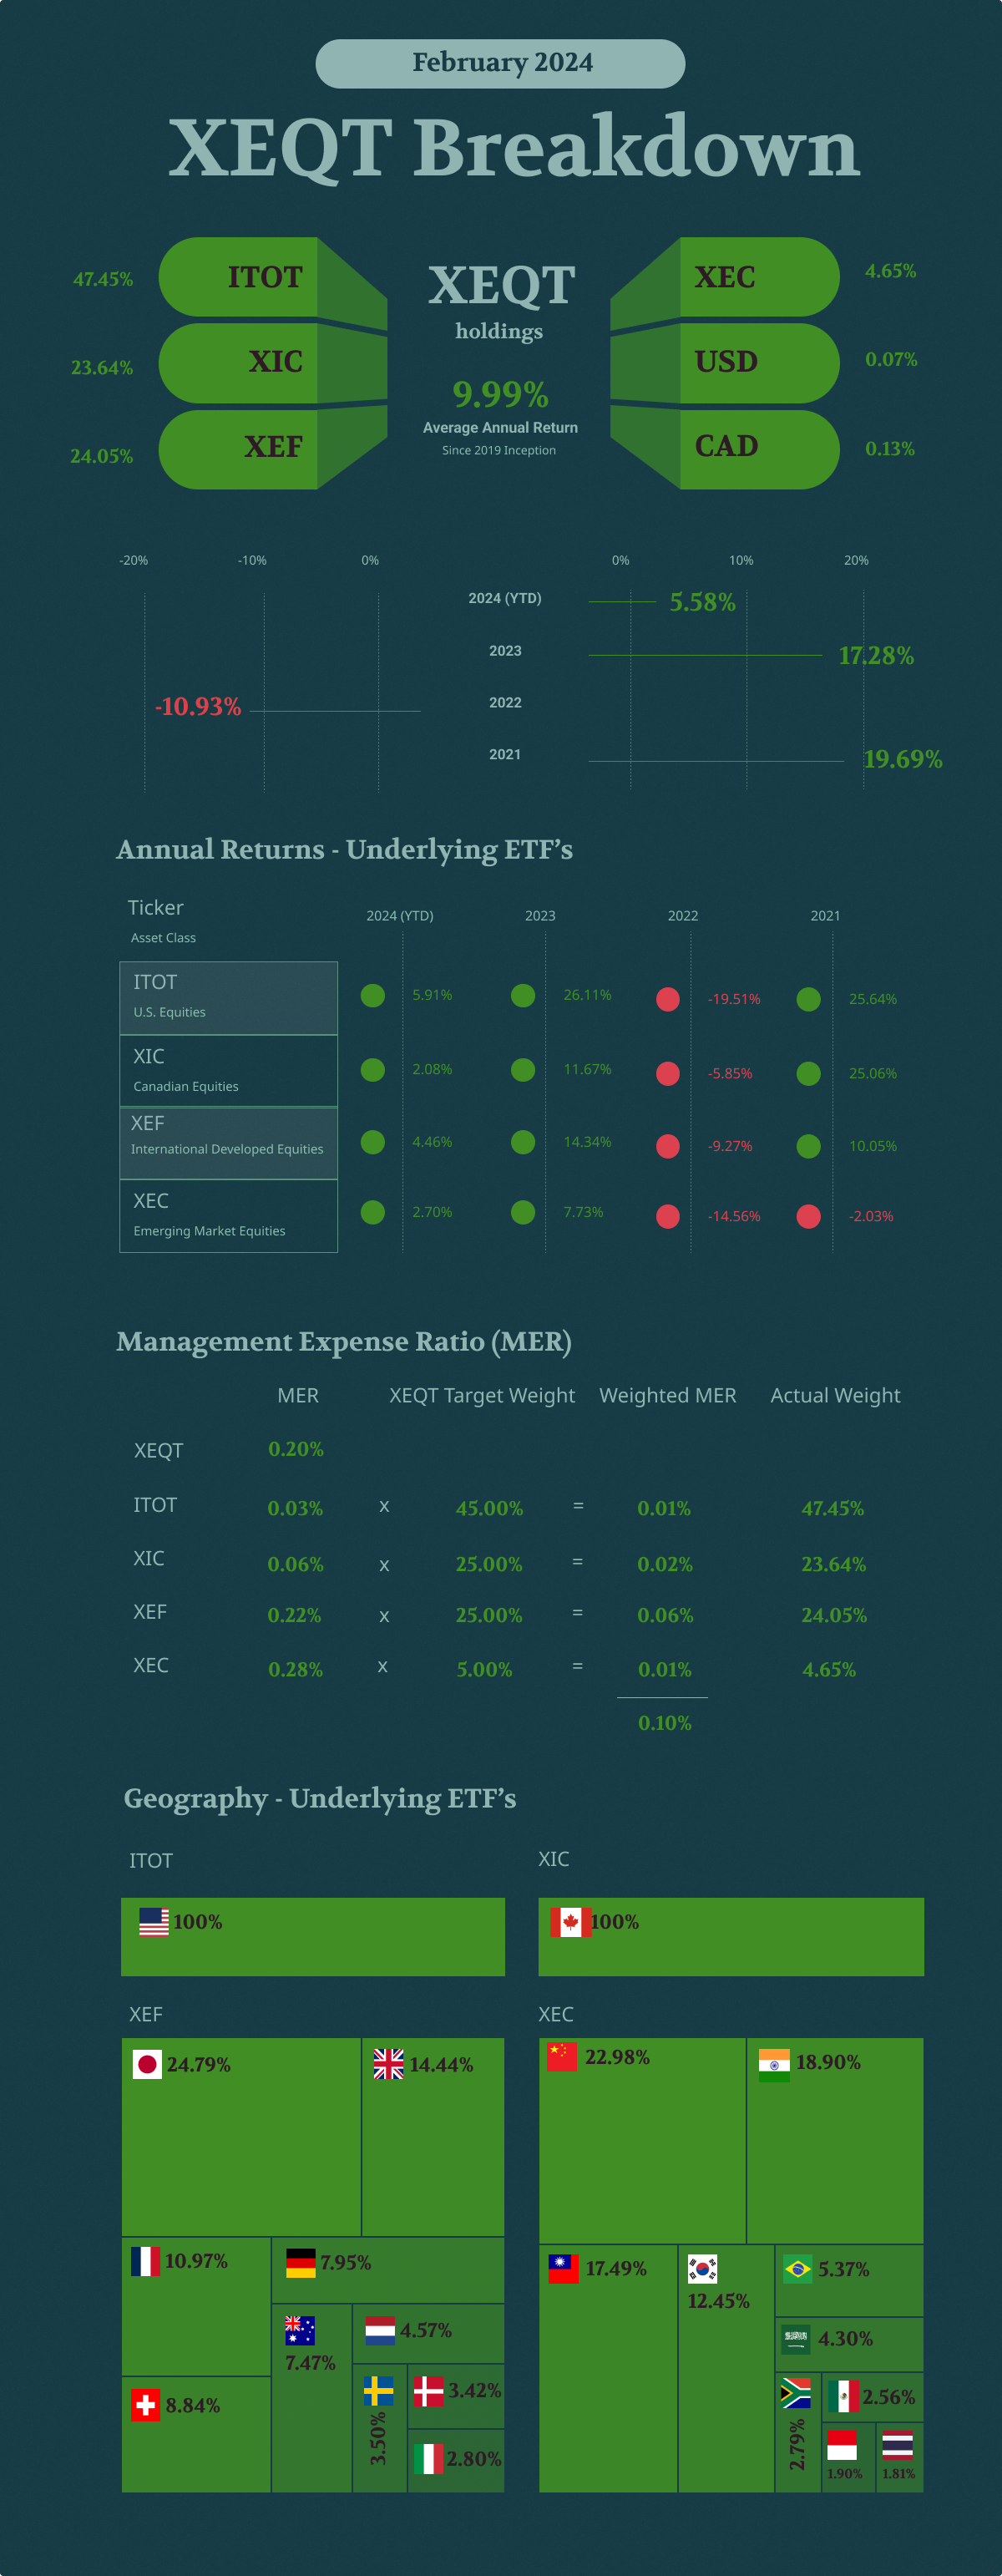
iShares Core Equity ETF (XEQT) is made up of four underlying ETFs – and the allocation of these ETFs was as follows (as of January 26, 2024):
- ITOT - iShares Core S&P Total U.S. Stock ETF: 47.45%
- XIC - iShares S&P/TSX Capped Composite ETF: 23.64%
- XEF - iShares MSCI EAFE IMI Index ETF: 24.05%
- XEC - iShares Core MSCI Emerging Markets IMI Index ETF: 4.65%
These four funds look to provide XEQT with global diversification – giving investors access to over 8500 individual stocks.
Target Weights
XEQT looks to maintain target weights among these four underlying ETFs. Each of these underlying ETFs can deviate by 10% before automatic rebalancing occurs. For Canadian equities which is currently represented by XIC – the target weight is 25%. If this target weight deviates by more than 10% (which would indicate a maximum weight of 27.5% or minimum weight of 22.5%) then XEQT would rebalance its holdings to correct XIC back to target. The target weight for ITOT (U.S equities) is 45%, with XEF (International Developed Market Equities) at 25% and XEC (Emerging Market equities) at 5%.
Performance
Year-to-Date Performance - February 26, 2024
XEQT has seen strong annual YTD performance with a 5.58% return as of Feb 26, 2024. This positive return has been driven by the four underlying ETFs which have all experienced positive YTD returns for 2024. ITOT has had the highest year-to-date returns of 5.91%, followed by XEF at 4.46%, XEC at 2.70%, and 2.08 for XIC.
Historical Annual performance
XEQT has seen an average annual return of 9.99% since its 2019 inception of the fund. This average annual return is the combination of varied performance over the short lifetime of XEQT. In 2023 XEQT saw strong annual returns of 17.28%. The fund faced a downturn in 2022 with annual returns of -10.93%. 2021 saw strong annual returns of 19.69%.
Management Expense Ratio (MER)
XEQT has a management expense ratio of 0.20% – this is the only expense ratio that you will need to pay when you hold XEQT. This expense ratio is considered to be low cost which helps investors maximize their returns. However, the MER for XEQT is higher than if you were to purchase these stocks individually. ITOT has a management expense ratio (MER) of 0.03%, XIC has a MER of 0.06%, XEF has a MER of 0.22% and XEC has a MER of 0.28%. When taking the weighted average of these management expense ratios, the MER would be 0.10% (as shown in the infographic above).
XEQT home country bias
With a target weight of 25% in Canadian equities, XEQT has a large home-country bias. A home country bias can cause investors to allocate too much towards investments in their home country. This can introduce more risk into a portfolio if it is not properly diversified as well as lead to missed opportunities from international investments. However, when a home country bias is used properly it can help to lower volatility, improve tax efficiency, and protect investors from currency risk.
XEQT vs. VEQT
While XEQT is Blackrock's all-equity exchange-traded fund, VEQT is similar as it is also an all-equity ETF issued by Vanguard. Since both funds invest exclusively in equities, there is more risk associated with these funds – which may offer the potential for higher returns. When comparing the management expense ratio for VEQT vs. XEQT we see that XEQT has a lower MER of 0.20% compared to VEQT which has a MER of 0.24%. Both funds look to provide investors with exposure to the global stock market while providing a home-country bias for Canadian investors.
| Asset Class | XEQT Target Weight | VEQT Target Weight |
|---|---|---|
| Canadian Equities | 25% | 30% |
| U.S. Equities | 45% | 42.5% |
| International Developed Market Equities | 25% | 20% |
| Emerging Market Equities | 5% | 7.5% |
Both funds look to invest in Canadian, U.S., International developed markets, and emerging market equities to provide global diversification. While the weightings between these categories are similar, VEQT has a target weight of 30% in Canadian equities compared to XEQT with a weight of 25%. XEQT has slightly more weighted towards U.S equities with 45% compared to VEQT with 42.5%. Looking at the International developed market equities, VEQT has a target weight of 20% compared to XEQT with a target weight of 25%. Lastly, XEQT has a lower target weight of 5% for emerging markets compared to VEQT’s 7.5%.